Examples of Visualization
less than 1 minute read
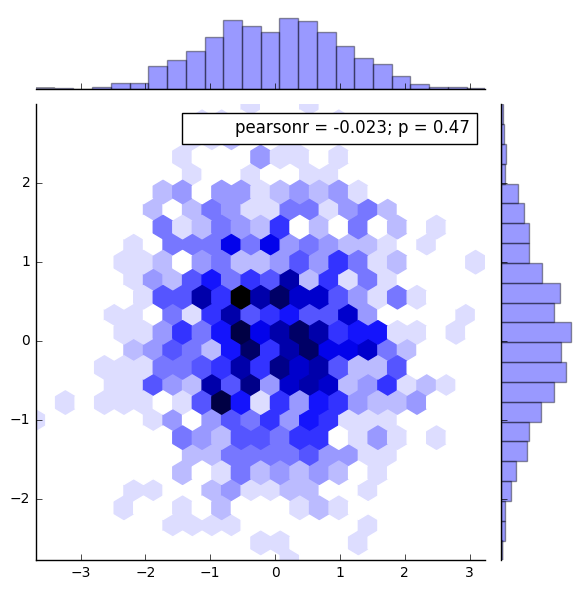
Jointplots Hex
sns.jointplot(data1,data2,kind='hex')
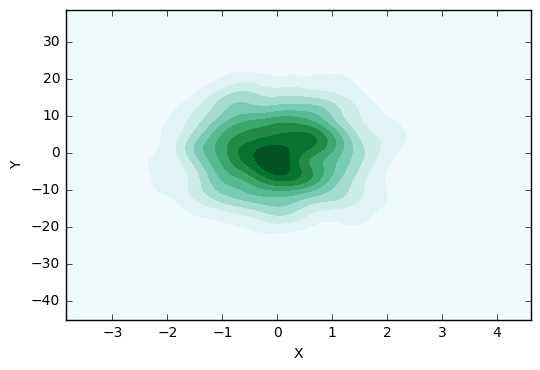
KDE Plots
sns.kdeplot(dframe.X,dframe.Y,shade=True)
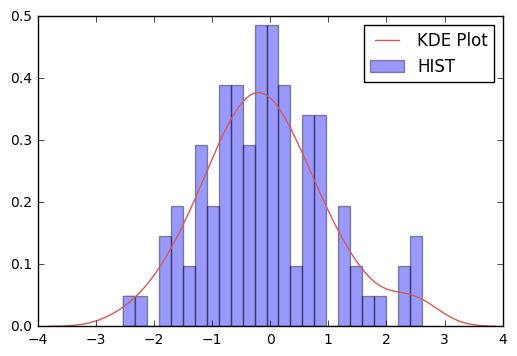
KDE & Histogram Plot
	sns.distplot(dataset,bins=25,
            kde_kws={'color':'indianred','label':'KDE Plot'},
            hist_kws={'color':'blue', 'label':'HIST'})
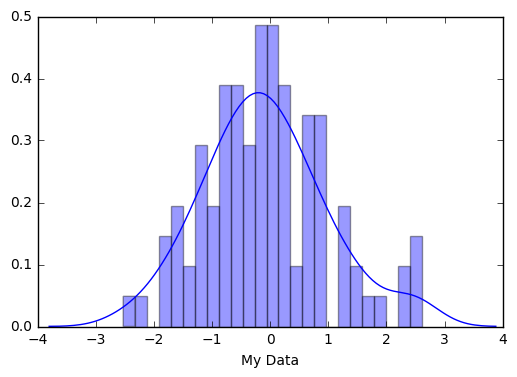
Distribution Plots
sns.distplot(ser1,bins=25)
Jointplots Hex
sns.jointplot(data1,data2,kind='hex')
KDE Plots
sns.kdeplot(dframe.X,dframe.Y,shade=True)
KDE & Histogram Plot
	sns.distplot(dataset,bins=25,
            kde_kws={'color':'indianred','label':'KDE Plot'},
            hist_kws={'color':'blue', 'label':'HIST'})
Distribution Plots
sns.distplot(ser1,bins=25)